 Real-time Request Level Time Chart
 |
|
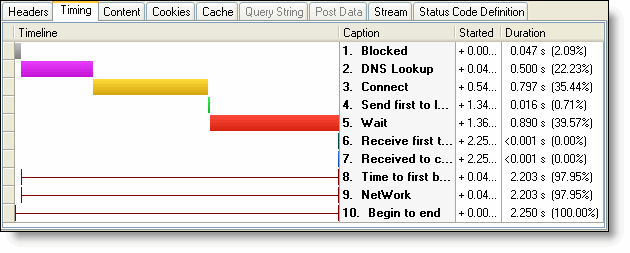
The colored time chart is used to express the
relative time between a single network level
timing (i.e. , DNS lookup, TCP connects) and
other timing segments in the same request. |
 |
|
 Real-time Page/Process Level Time Chart
 |
|
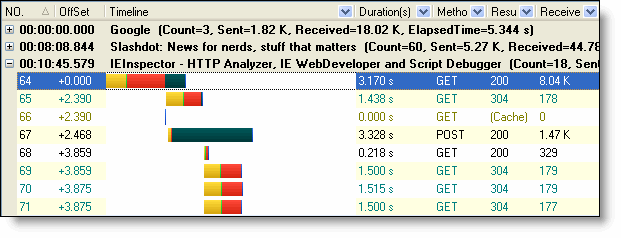
The colored bars are used to express the
relative timing of requests in the same group (
Webpage for Add-on, Process for Stand-alone)
and the different phases of an HTTP request,
e.g. blocked, connect, etc. It shows directly
and visually how a site is performing, which can
help the user to find and diagnose the common
problems quickly . |
 |
|
 Real-time Multi-level summaries
 |
|
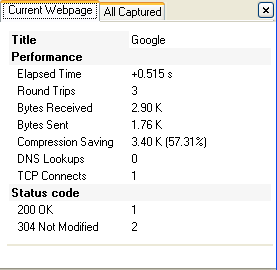
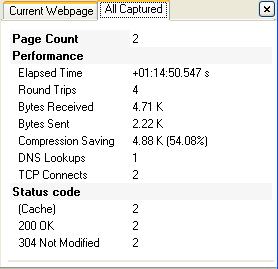
The summary panel displays the real-time updated
summary information on the HTTP/HTTPS requests
in a single webpage, a single monitored process
or the whole log. |
 |
 |
|
 Grouping Of Requests By Page/Process
 |
|
In Add-on Edition, Requests are now grouped by
page by default. while in Stand-alone Edition,
Requests are grouped by process name by default.
Each group can be separately expanded or
collapsed. Requests that are grouped can be
navigated more easily. |
 |
|
 |
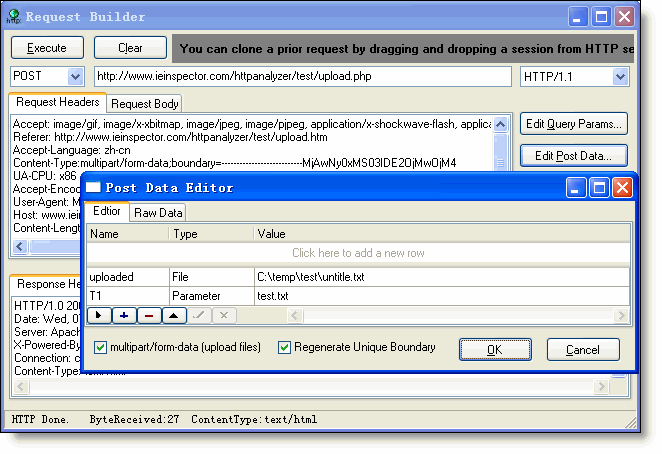
Improved Request Builder |
|
In V3, User can use
multipart/form-data POST method to upload files
(introduced in
RFC 1867) and View the response headers and
content. |
 |
|
 |
Build-in JSON Viewer |
|
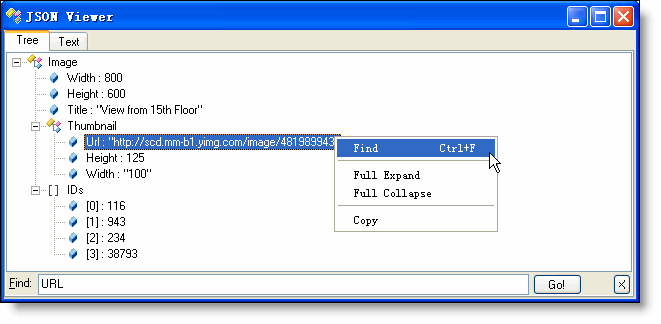
As
you can see below, the viewer simply
shows a tree structure representation of
the JSON format. You can use the "Send
to JSON Viewer" command in any editor to
directly send selected content to the
build-in JSON Viewer. |
 |
|
 |
Star a recorded request |
|
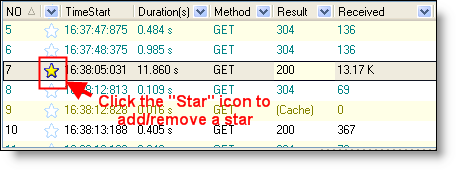
Add or remove a star to a recorded request.
Stars allow you to give a request a special
status. the user can also use the the dropdown
filter button of the new "Starred" column to
change the filter criteria (starred or not). |
 |
|
 |
Find/Search Dialog |
|
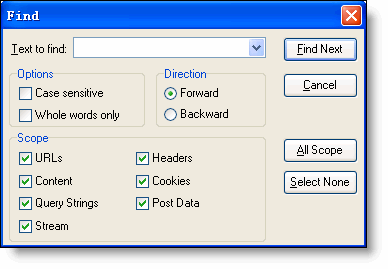
Use the new "Find" dialog to "globally" locate
text in the log of recorded requests. The search
attributes can be: URLs, Headers, Content,
Cookies, Query strings, Post data, Stream.... |
 |
|
 |
Native Log Files, Smaller and More
Information |
|
HTTP Analyzer V3 introduced a new log file
format (*.halog), Compared to the
previous XML version, it has a smaller size, and
can record more information. In V3, HTTP Log
records will been save as this file format by
default. |
|
 |
Improved Automation Interface. |
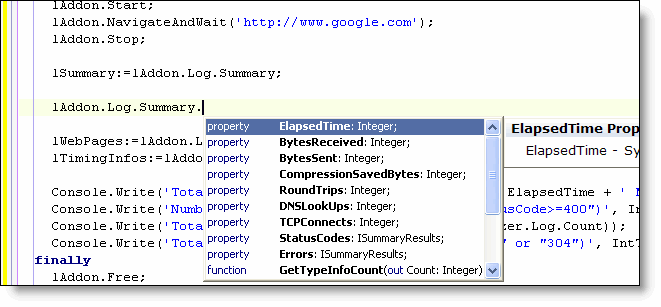
- Summary Information Added to Automation
Interface
- Request Level timings Added to
Automation Interface
- Entry Group (Webpage/process)
information Added to Automation Interface
- Add two events to automation library HTTPAnalyzer class. One is OnNewEntry(HTTPAnalyzer.ILogEntry,
ref bool) ,Occurs immediately before an new LogEntry adds to log.
The other is OnUpdateEntry(HTTPAnalyzer.ILogEntry) , Occurs
when update a specific Logentry in the log.
|
 |
|
 |
Flexible Appearance Options |
|
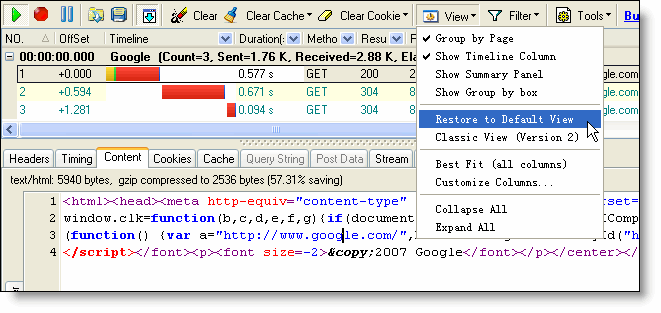
A new "View" menu item has been added to the
toolbar and main menu. It contains many
appearance options for the session grid View. |
 |
|
 |
Collect HTTP Log from Customers and Users |
|
HTTP Analyzer V3 relaxed the limitation of trial
version. After it expired, trial version user
still can record http log files and send log
files to a licensed user to illustrate a problem
without having to purchase extra licenses.
|
|
 |
More minor improvements |
- Add a "Offset" column that displays an
offset in seconds from the first entry in
the current group (web page or process).
- Add a "Web page" column that displays
the web page title of the current request.
- Add a "Send to JSON Viewer..." command
to popup menu of the content editor to send
selected content to JSON viewer to parse the
JSON content as a tree structure.
- Add a "Font..." command to popup menu of
content editor to change the display font.
- Re-arrange the command items in the
toolbar and main menu.
- Allow to install
Version 3.0 on a system which already has
Version 2.x or Version 1.x installed.
|
|
|

