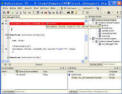
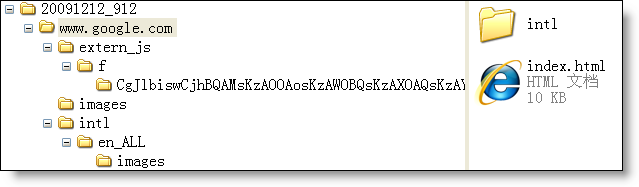
Export the captured webpage with directory
structures
Export the captured webpage with directory
structures |
|
In the previous builds, The "File->Export
response content to dir..."" action will export
all captured files to a flat directory, while
the current build will export the whole page
with directory structures. |
 |
|
Add-on for Mozilla Firefox |
|
HTTP Analyzer now offers an add-on for Mozilla
Firefox (Firefox 2.0 is not supported). HTTP
Analyzer now supports Firefox 3.0 on Windows as
well as IE 6, 7 and 8. |
 |
|
|
Automation Support in Mozilla Firefox |
|
The automation library has been update to allow
the control of Http Analyzer within Mozilla
Firefox. The IHTTPAnalyzerFirefox object is used
to control the HTTPAnalyzer Firefox Add-on. |
 |
|
New in version
4.x
|
|
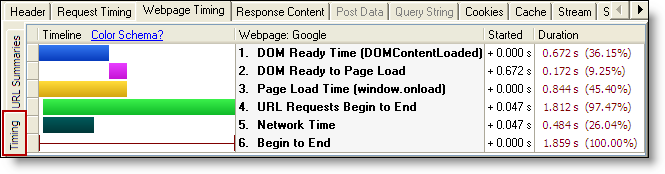
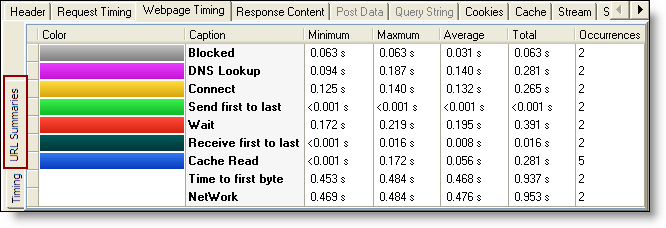
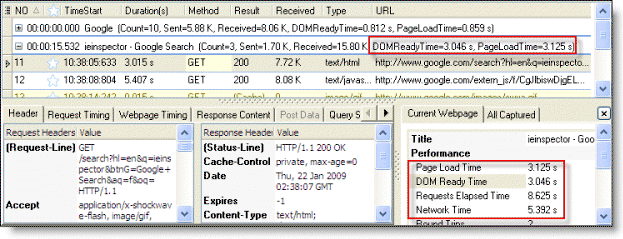
DOMReadyTime and PageLoadTime (Add-on Edition
Only) |
|
The "DOMReadyTime" is the loaded time of webpage
DOM tree, the "PageLoadTime" is fully-loaded
time of the webpage. The DOMReady is fired when
the DOM content has loaded and you can access
all HTML Elements without having to wait for all
those images or binary objects to load as well
(PageLoadTime). Please note that "PageLoadTime"
is not calculated by the child requests timing.
HTTP Analyzer gets DOMReadyTime and PageLoadTime
by listening the corresponding webpage events.
The data is more accurate and reliable. |
 |
|
|
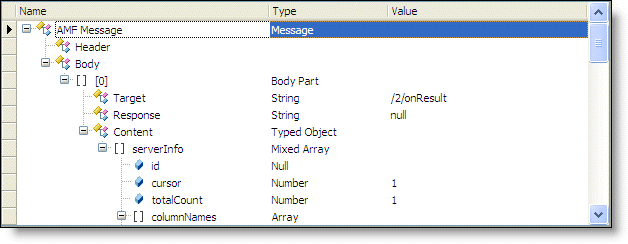
Native support for Flash Remoting |
|
HTTP Analyzer is especially useful for Adobe
Flash developers as you can view the request and
response of LoadVariables, LoadMovie and XML
loads. It also can deserialize and display all
Flash Remoting or AMF (AMF0 and AMF3) traffic in
a easy-to-use AMF object tree. |
 |
|
|
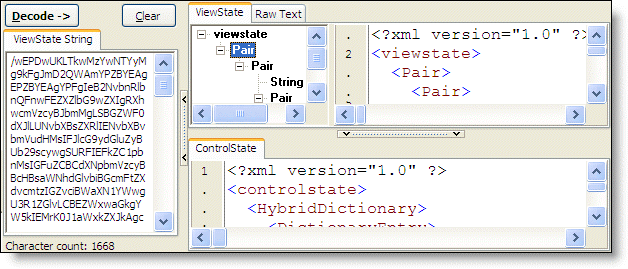
Decode ASP.NET ViewState |
|
HTTP Analyzer can read and decode the hidden
viewstate on an ASP.NET Page. It displays the
hidden ViewState in a tree view, raw text, or in
XML format. . |
 |
|
|
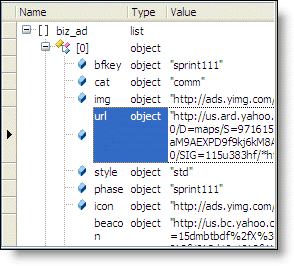
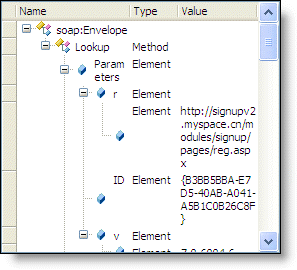
JSON and SOAP Object Tree |
|
HTTP Analyzer can deserialize SOAP and JSON
traffic into the easy-to-use object trees. |
 |
 |
|
|
|
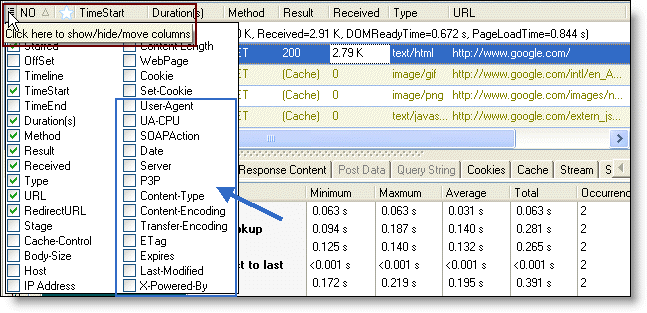
More new columns and the new quick
column button |
|
13 new columns are added to session
grid. You can use the new quick column
button to toggle columns' visibility and
reorder columns by dragging items in the
dropdown. |
 |
|
|
|
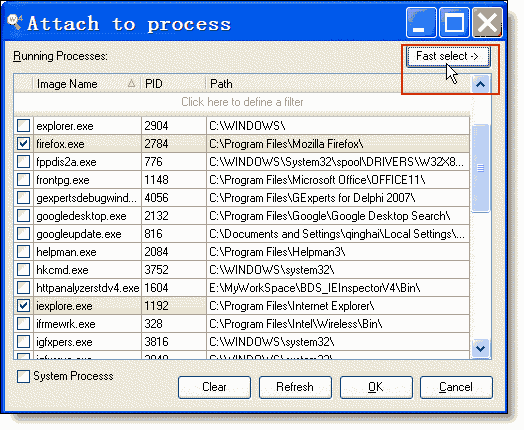
Attach to multiple processes (Stand-alone) |
|
In addition to monitoring system-wide processes
or single process, HTTP Analyzer allows user to
select more running processes and monitor these
particular processes. |
 |
|
|
|
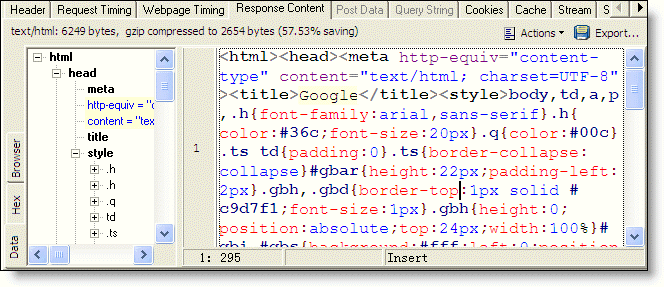
Improved Text View |
|
Improved Text View with syntax highlighting,
text folding, text structure tree view. |
 |
|
|
|
Support OpenSSL HTTPS (Stand-Alone) |
|
HTTP Analyzer can show you unencrypted data sent
over HTTPS / SSL connections as the same level
of detail as HTTP. With the new support to
OpenSSL API , now HTTPS is available if the
application uses the Microsoft WININET API ,
Mozilla NSS API or OpenSSL API. |
|
|
|
Display Start Times as Offsets, UTC/GMT or
Local Time |
|
A group of menu items have been added to view
menu, which control the display of start time.
This feature is particularly useful for locating
related events across multiple locations and
time zones. |
|
|
|
Use Hotkey to Show/Hide Add-on (Add-on Only) |
|
In the Version 4.x, HTTP Analyzer Add-on window
can be shown/hidden by using the Hotkey (ALT+SHIFT+F2). |
|
|
|
Undock button (Add-on Only) |
|
User can undock the whole HTTP Analyzer Add-on
window from Internet Explorer by using the
'Undock/Dock' button in the upper right corner.
This feature is particularly useful for
dual-monitor or high-resolution display system.
The Keyboard shortcut of the command is
ALT+SHIFT+F3. |
|
|
|
More minor improvements |
- Add a Visual C++ Demo to Automation
Interface.
- Add AverageHTTPSOverhead and
TotalHTTPSOverhead to summary panel.
- Add "Show All Columns" to view menu to
show all available grid columns in the
session grid..
- Add "Expand New Page" to view menu to
control whether new WebPages are initially
expanded or collapsed.
- The automation interface has been
updated to support timing summaries and
webpage timing properties.
- Allow to install
Version 4.0 on a system which already has
Version 3.x, 2.x or 1.x installed.
|
|
|
|
New in Version 3.x |
|
About new features in version 3.x please refer
to "New in Version 3.x". |
|
|